
An Account Optimised for the Wrong Number
In June 2024 the account produced 18.24 conversions at ₴1,000 each against ₴66.1K of revenue, at an average CPC of ₴5.44. Structure, bidding and keyword selection were all pointed at a single goal: buy clicks as cheaply as possible.
Cheap clicks and cheap orders are not the same thing. At ₴1,000 per conversion on a parts catalogue, the account was paying premium prices for outcomes while congratulating itself on its cost per click.
Optimising for cost per click instead of profit?
A free audit shows what your account is actually buying.Four Changes. All Pointed at Profit.
The work was structural rather than tactical. Nothing here is a bidding trick — it is a rebuild of what the account was being asked to optimise toward.
Campaigns Restructured Around Profitability
Every campaign was rebuilt around profit-based segmentation rather than click cost. Keywords and ads that consumed budget without producing orders were removed rather than bid down.
Performance Max Combined With Retargeting
Performance Max was introduced for coverage across Search, Shopping and the wider inventory, paired with retargeting for abandoned carts and product views so that existing intent was not left to cool.
Automated Bidding With Manual Exclusions
Bidding moved to automated strategies, with manual exclusions kept in place so the algorithm could not drift back toward the cheap, unprofitable inventory the old account had been feeding on.
Faster Pages and a Streamlined Checkout
Landing pages were sped up and checkout friction removed. Traffic quality improvements are wasted if the site loses the visitor between the product page and the order.
20× the Orders. Same Money.
By August 2024 the account was producing 357.76 conversions at ₴54.48 each against ₴98.6K of revenue — with the budget effectively where it started.
| Metric | Before | After | Change |
|---|---|---|---|
| Conversions | 18.24 | 357.76 | ↑ ×19.6 |
| Cost per conversion | ₴1,000 | ₴54.48 | ↑ ↓18.4× |
| Revenue | ₴66.1K | ₴98.6K | ↑ +49% |
| Average CPC | ₴5.44 | ₴4.68 | ↑ ↓14% |
| ROAS (derived) | ×3.62 | ×5.06 | ↑ ×1.40 |
| Ad spend (derived) | ≈₴18.2K | ≈₴19.5K | ↑ +7% |
ROAS and ad spend are derived — spend is conversions × cost per conversion, ROAS is revenue ÷ spend, both from figures shown in the screenshots.
The budget did not meaningfully move. Revenue rose 49% because the same money was pointed at orders instead of clicks — which is the whole difference between a cheap account and a profitable one.
The Screenshots Behind Every Number
Both panels below are the account's own Google Ads reporting for the two months compared above. Every number in this case study is read off them.
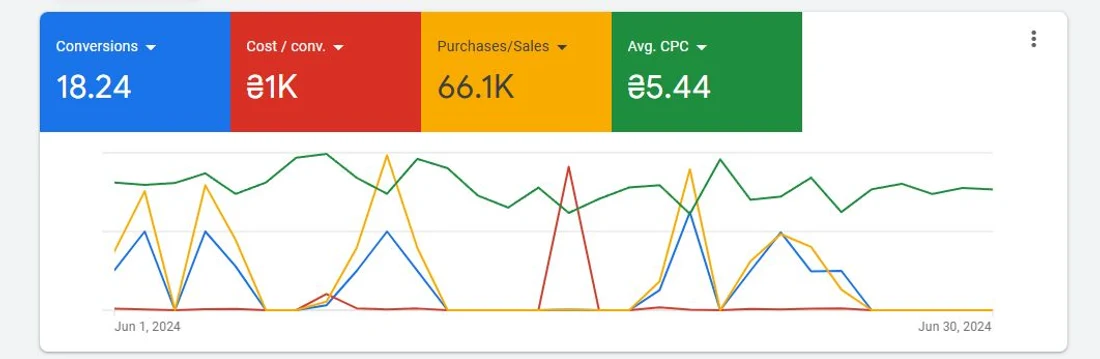
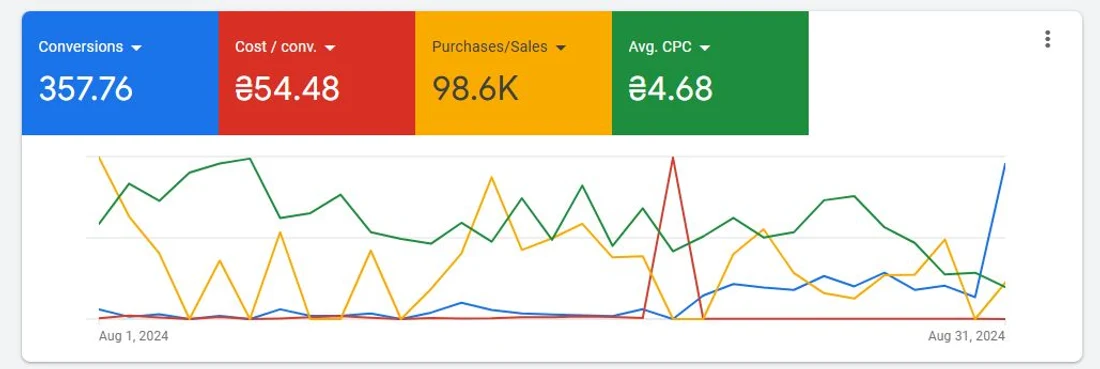
Ad spend was not literally identical. Derived from the screenshots it rose from roughly ₴18.2K to ₴19.5K — about 7%. We describe the budget as flat because a 7% move over two months is small next to a 49% revenue gain, but the figures are here rather than rounded away.
Get This Case Study as a PDF
The complete 7-page breakdown — baseline, intervention, before-and-after evidence, and the results — saved for whenever you need it.
Your download is starting. We've also sent a confirmation link to your inbox — click it to keep getting new case studies. Didn't start? Click here.
🔒 No spam. Case studies and marketing tips only. Unsubscribe anytime.
Is This Your E-Commerce Account?
This case study is relevant if any of the following sounds familiar: