Break-Even Spending, at Scale
Between January and May 2024 the account spent $401K and produced 1.88K purchases at $213 each, at an actual ROAS of 105.35%. In other words, roughly a dollar back for a dollar spent — before the cost of the goods, the fulfilment or the team.
An account at 105% ROAS is not failing loudly. It is running a large volume of activity for very little margin, which is a comfortable place to sit for a long time. The brief was to stop doing that: keep the return, remove the spend that was not earning it.
Spending heavily at close to break-even?
A free audit shows which of that spend is actually earning.One Decision. Margin Over Volume.
This was not a growth engagement and the work reflects that. The account was not restructured for scale; budget was withdrawn from the traffic that was not paying for itself.
Budget Pulled Out of Low-Intent Traffic
Spend was withdrawn from the segments producing clicks and impressions without producing purchases at an acceptable cost. In an account running at break-even, this is where most of the money is.
Spend Concentrated on High-Intent Buyers
The remaining budget was concentrated on the audiences and queries with genuine purchase intent, accepting a smaller addressable pool in exchange for a materially better cost per acquisition.
Campaign Quality Prioritised Over Volume
Reporting and optimisation targets were moved off click and impression volume. Once volume stops being the objective, the account stops defending spend that only produces volume.
36% Less Spend. 32% Lower CPA. Same Return.
Across the same five months a year later the account spent $258K, produced 1.14K purchases at $145 each, and recorded an actual ROAS of 102.68% — within three points of where it started.
| Metric | Before | After | Change |
|---|---|---|---|
| Ad spend | $401K | $258K | ↑ ↓36% |
| Cost per acquisition | $213 | $145 | ↑ ↓32% |
| Actual ROAS | 105.35% | 102.68% | → −2.5% |
| Purchases | 1.88K | 1.14K | ↓ −39% |
| Revenue (derived) | ≈$422K | ≈$265K | ↓ −37% |
Revenue is derived — ad spend × actual ROAS, from the two figures shown in each screenshot.
$143K of spend was removed at effectively the same return. Whether that is a good outcome depends entirely on what the business wanted the channel to do — which is why the volume figures are in the table rather than left out of it.
The Screenshots Behind Every Number
Both panels below are the account's own Google Ads reporting for the two periods compared above. Every number in this case study, including the ones that fell, is read off them.
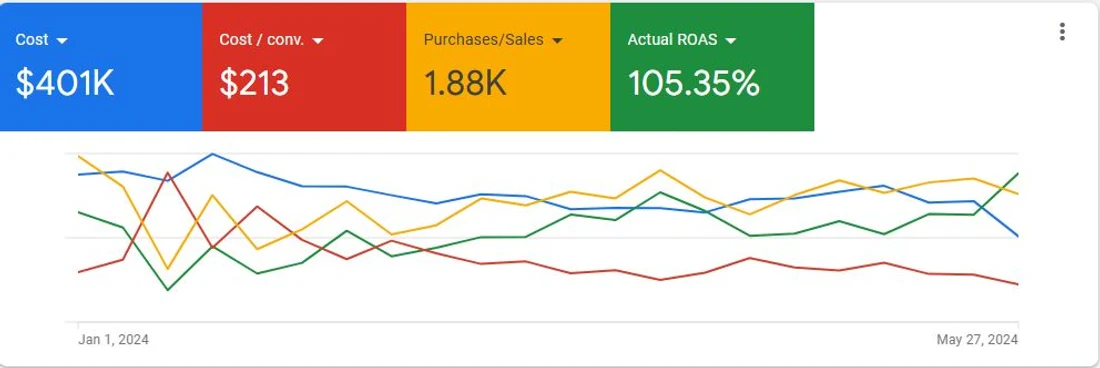
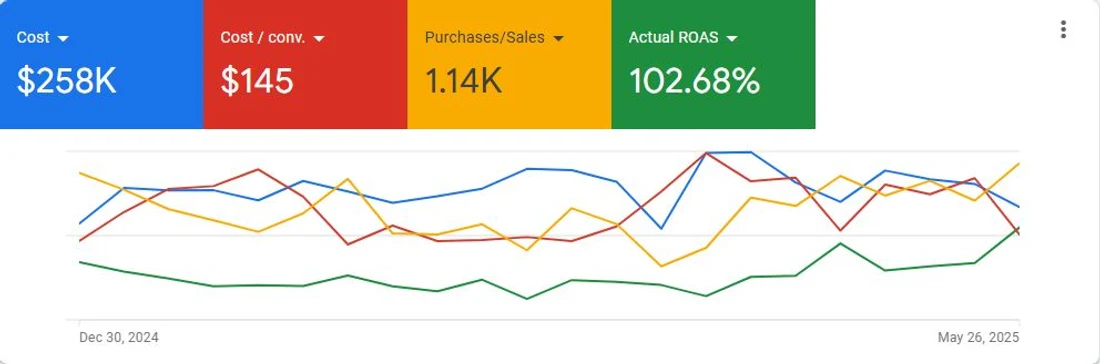
This is an efficiency case, not a growth case. Purchases fell from 1.88K to 1.14K and revenue with them, from roughly $422K to $265K. If the objective is top-line growth, these are the wrong numbers and we would not present them as anything else. If the objective is to stop spending $143K a year to stand still at break-even, they are the right ones. We publish it as the latter and leave you to judge which situation is yours.
Get This Case Study as a PDF
The complete 7-page breakdown — baseline, intervention, before-and-after evidence, and the results — saved for whenever you need it.
Your download is starting. We've also sent a confirmation link to your inbox — click it to keep getting new case studies. Didn't start? Click here.
🔒 No spam. Case studies and marketing tips only. Unsubscribe anytime.
Is This Your Account?
This case study is relevant if any of the following sounds familiar: