
Profitable Already — and Stuck.
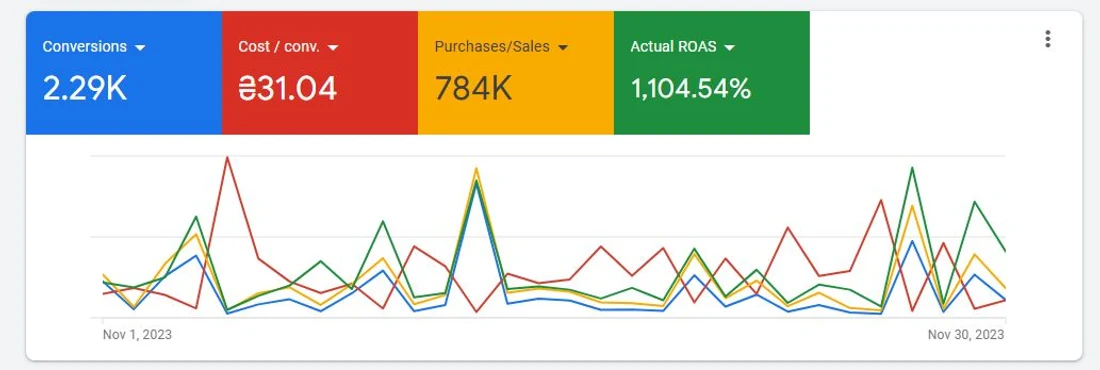
In November 2023 the account produced ₴784K of revenue on roughly ₴71K of spend: 2.29K conversions at ₴31.04 each, at an actual ROAS of 1,104.54%. On paper it was working well.
The ceiling was structural. Generic ad groups meant bidding could not distinguish a high-value brand part from a low-value consumable. A cluttered mobile journey lost buyers between the product page and the order. Neither problem shows up in a monthly ROAS figure that already looks healthy — which is exactly why accounts like this sit still for years.
Account profitable but stuck at the same ceiling?
A free audit finds the structural limit, not the bidding one.Five Changes. Segmentation First.
A profitable account is a harder brief than a broken one — there is a working system to avoid damaging. The sequence mattered: segmentation before automation, and measurement before either.
Campaigns Segmented by Brand and Category
The account was broken out by brand and by product category so that bidding could treat a high-value component differently from a consumable. Generic ad groups cannot express that difference, and no bid strategy can compensate for it.
Performance Max Launched on Top Sellers
Performance Max was introduced on the best-selling lines first, where the conversion data was densest and the algorithm had the most to learn from — rather than across the whole catalogue at once.
Mobile Journey Simplified
The mobile path to checkout was shortened. On a parts marketplace this is not cosmetic: buyers arrive knowing the part they need, and every additional step is an opportunity to lose an order that was already won.
Cart Abandoners Retargeted
Retargeting was built for cart abandoners and product viewers, recovering demand the account had already paid to acquire.
Real Profit Tracked With GA4 and a Custom ROAS Model
GA4 was paired with a custom ROAS model so that reporting reflected what orders were actually worth, rather than treating every conversion as equivalent. Without that layer, segmentation has nothing to optimise against.
6.5× the Revenue on 1.9× the Budget
By November 2024 the account was producing ₴5.06M of revenue a month at an actual ROAS of 3,764.13%, on roughly ₴134K of spend.
| Metric | Before | After | Change |
|---|---|---|---|
| Revenue | ₴784K | ₴5.06M | ↑ ×6.45 |
| Actual ROAS | 1,104.54% (×11.0) | 3,764.13% (×37.6) | ↑ ×3.41 |
| Conversions | 2.29K | 3.59K | ↑ +57% |
| Cost per conversion | ₴31.04 | ₴37.45 | ↑ +21% |
| Ad spend (derived) | ≈₴71K | ≈₴134K | ↑ ×1.89 |
Ad spend is derived — conversions × cost per conversion, from the two figures shown in each screenshot.
Revenue grew 6.5× on 1.9× the budget. The gap between those two multiples is the entire value of the work — everything else is detail about how it was produced.
The Screenshots Behind Every Number
Both panels below are the account's own Google Ads reporting for the two months compared above. Every number in this case study is read off them.
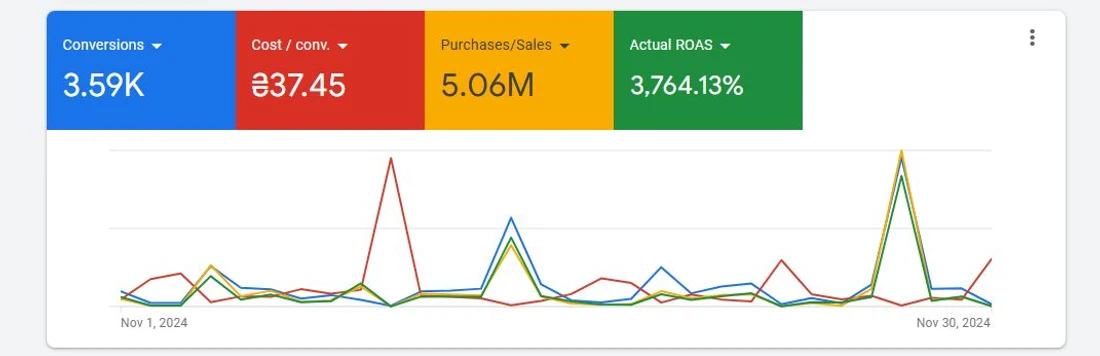
Cost per conversion rose 21%, from ₴31.04 to ₴37.45. That was the intended trade rather than a side effect: segmenting by brand and category deliberately pushed spend toward higher-value orders, so each conversion costs more and is worth considerably more. An account managed to keep cost per conversion flat would not have produced this result.
Get This Case Study as a PDF
The complete 7-page breakdown — baseline, intervention, before-and-after evidence, and the results — saved for whenever you need it.
Your download is starting. We've also sent a confirmation link to your inbox — click it to keep getting new case studies. Didn't start? Click here.
🔒 No spam. Case studies and marketing tips only. Unsubscribe anytime.
Is This Your Marketplace Account?
This case study is relevant if any of the following sounds familiar: