SaaS Lead Generation: 2.3× ROAS and 2.8× Conversions
A B2B SaaS company needed to scale lead volume quickly without letting cost per lead climb alongside it. Between November 2024 and March 2025 we rebuilt campaign targeting, landing pages and CRM tracking. Both account screenshots are published further down this page.
×2.3
ROAS Improvement
×2.8
Conversions
↓28%
Cost per Conversion
5 Months
Timeline
The Situation
Growing Volume Without Growing Cost
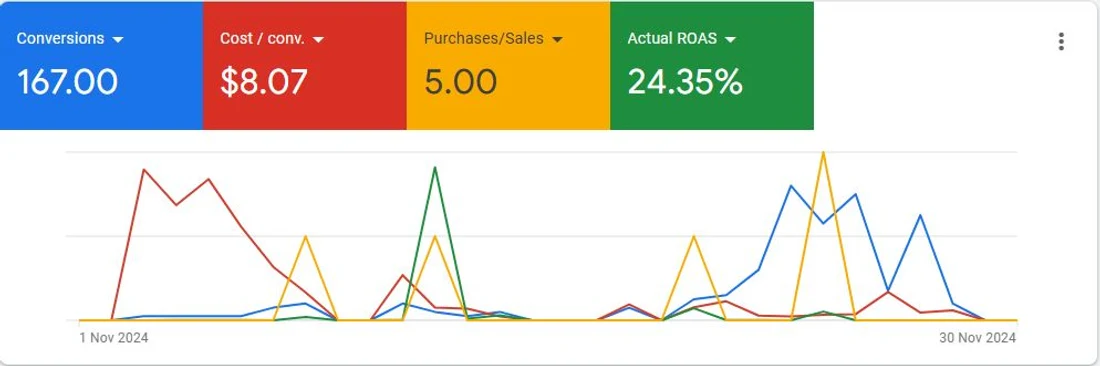
The account converted, but every attempt to push volume moved cost per conversion the wrong way. In November 2024 it produced 167 conversions at $8.07 each, five sales, and an actual ROAS of 24.35%.
For a subscription business a sub-100% platform ROAS is not automatically a failure — Google Ads records the first payment, not the lifetime value of the subscription. What mattered was the direction of travel: more budget was buying proportionally more cost, not more efficiency.
Before — November 2024
167
Conversions
$8.07
Cost / Conversion
5.00
Purchases / Sales
24.35%
Actual ROAS
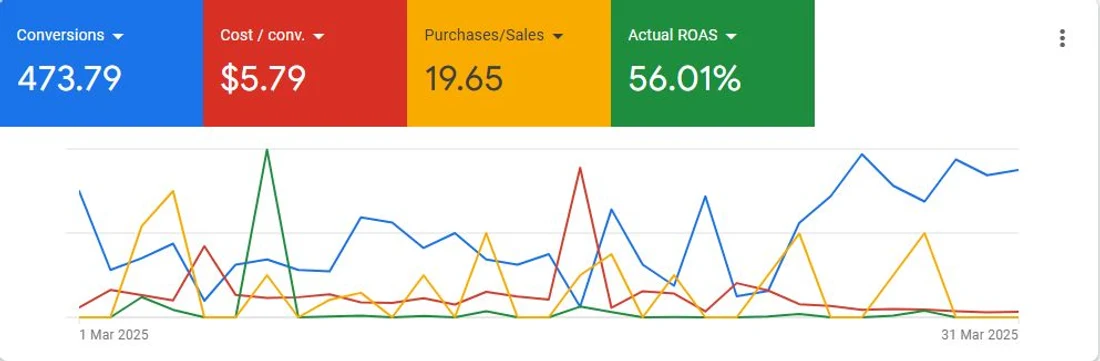
After — March 2025
473.79
Conversions
$5.79
Cost / Conversion
19.65
Purchases / Sales
56.01%
Actual ROAS
Scaling volume, but cost per lead climbs with it?
A free audit shows you where the account is buying the wrong queries.
The Approach
Three Changes. Targeting, Pages, Tracking.
Nothing exotic. The account had three separate leaks and we closed them in order — traffic quality first, then what that traffic landed on, then what the account could actually see about the leads it produced.
1
Google Ads Targeting Rebuilt Around Qualified Intent
Campaign targeting was rebuilt around the queries that produced qualified leads rather than the ones that produced volume. Terms that generated form fills but never generated pipeline came out of the account.
Pages were rebuilt for conversion rate rather than traffic: message match against the query that bought the click, fewer form fields, and a clearer single action per page.
Page-level CROForm friction cutMessage match
3
CRM Integrated for End-to-End Lead Tracking
The CRM was connected so the account could see what happened to a lead after the form. That turns bidding from an optimisation toward form fills into an optimisation toward leads that close.
CRM integrationClick-to-close visibilityLead quality signal
Results
2.8× the Conversions at 28% Less Cost Each
Five months later the account was producing 473.79 conversions a month at $5.79 each, sales had gone from 5 to 19.65, and platform-recorded ROAS was 2.3× the baseline.
Metric
Before
After
Change
Conversions
167.00
473.79
↑ ×2.84
Cost per conversion
$8.07
$5.79
↑ ↓28%
Purchases / sales
5.00
19.65
↑ +293%
Actual ROAS
24.35%
56.01%
↑ ×2.30
Ad spend (derived)
≈$1,348
≈$2,743
↑ ×2.03
Ad spend is derived — conversions × cost per conversion, from the two figures shown in each screenshot.
Core Insight
Spend roughly doubled while cost per conversion fell 28%. Both moved in the right direction at the same time, which is the only combination that lets an account scale rather than simply spend more.
The Evidence
The Screenshots Behind Every Number
Both panels below are the account's own Google Ads reporting for the two months compared above. Every number in this case study is read off them.
November 2024 — baselineGoogle Ads · 1–30 Nov 2024
The ROAS on this page is first-payment return as recorded by Google Ads. Subscription lifetime value is not included, so 56.01% understates what the account is worth over a year. We publish the platform figure rather than a modelled lifetime-value number because the platform figure is the one you can check against the screenshot above.
Free Download
Get This Case Study as a PDF
The complete 7-page breakdown — baseline, intervention, before-and-after evidence, and the results — saved for whenever you need it.
All 7 pages, account evidence and key takeaways included
Plus occasional emails on new case studies and marketing tips — no spam
✅
Your download is starting. We've also sent a confirmation link to your inbox — click it to keep getting new case studies. Didn't start? Click here.
🔒 No spam. Case studies and marketing tips only. Unsubscribe anytime.
Is This Your Search Account?
This case study is relevant if any of the following sounds familiar:
You can grow conversions or hold cost per conversion, but never both in the same quarter
Your landing pages were built for traffic in general, not for the specific queries you pay for
Your CRM and your ad account do not talk, so bidding optimises toward form fills rather than closed deals
You run a subscription business and are unsure whether a sub-100% platform ROAS is actually a problem
Your reporting shows platform conversions but nothing about what those leads became
30 min · Free · We'll show you the gaps, no strings attached
Frequently Asked
Questions About This Case Study
Because Google Ads records the first payment, not the lifetime value of a subscription. For a SaaS business billing monthly, the platform sees one month of revenue against the full acquisition cost, so a healthy account can show a ROAS well under 100% and still be profitable over a customer lifetime. The figure that matters here is the change — 24.35% to 56.01%, a 2.3× improvement — because both readings are measured the same way.
It means the platform-recorded return improved 2.3×. Whether that crosses into profit depends on lifetime value, gross margin and churn — three things that live in the business, not in Google Ads. We are careful about this distinction: a case study can honestly claim the change it measured, and cannot honestly claim a profitability outcome it never had the data to see.
Targeting changes typically surface within two to four weeks, because bidding needs enough conversion volume to recalibrate. Landing page changes show up faster in conversion rate but take longer to affect cost per conversion, since bidding has to learn the new rate. CRM-informed bidding is the slowest of the three — it needs a full sales cycle of closed-loop data before it can influence anything. This account was measured over five months for that reason.
It lets you import offline conversion events — a qualified lead, a demo held, a deal closed — back into the ad account. Bidding then optimises toward those events instead of toward raw form submissions. In practice this usually means the account stops buying the cheap, high-volume queries that produce unqualified fills and starts paying more per lead for queries that produce pipeline.
Because case study numbers are otherwise unverifiable. Any agency can write "2.3× ROAS" on a page. Publishing the panel the figure was read from lets you check the claim, see the metrics we did not lead with, and judge whether the comparison periods were chosen fairly.