
Scaling in a Vertical That Punishes Scale
In January and February 2024 the account spent $13,353.70 to produce 128 conversions at $104.33 each, converting 3.36% of clicks. Those are respectable numbers for a competitive medical category.
The difficulty was the next step. In high-competition health verticals, additional budget usually buys progressively worse inventory: the efficient auctions are already saturated, so growth comes with a rising cost per lead almost by default. The brief was to grow volume without accepting that trade.
Every budget increase raising your cost per lead?
A free audit shows whether the ceiling is the auction or the account.Four Changes. Signal Before Spend.
Growth without cost inflation is a measurement problem before it is a bidding problem. The account had to be able to see which enquiries were worth having before more money was put behind it.
Enhanced Call Tracking
Phone enquiries were captured as conversions rather than left invisible. In healthcare a large share of high-intent contact happens by phone, and an account that cannot see calls is optimising against a partial picture of its own results.
Audience Segments Refined Toward High Intent
Segments were tightened around the audiences that produced genuine patient enquiries, and away from the broad reach that produced traffic and little else.
Lead Scoring to Prioritise Follow-Up
Enquiries were scored so that the strongest were identified and called back first. This changes what the account optimises toward and it changes what happens to a lead after it arrives — both matter to the cost of acquiring a patient.
Multi-Touch Attribution Across Microsoft Ads, CTM and GA4
Microsoft Ads, CallTrackingMetrics and GA4 were connected so that a lead could be traced across the full path rather than credited to a single last touch. Without that, scaling decisions are made on partial data.
62% More Leads. Cost Per Lead Unmoved.
Across March and April 2024 the account spent $20,987.09 — 57% more than the baseline period — and produced 208 conversions at $100.90 each, slightly below the previous cost per lead rather than above it.
| Metric | Before | After | Change |
|---|---|---|---|
| Conversions | 128.00 | 208.00 | ↑ +62.5% |
| Cost per acquisition | $104.33 | $100.90 | ↑ ↓3.3% |
| Conversion rate | 3.36% | 3.70% | ↑ +10.1% |
| Spend | $13,353.70 | $20,987.09 | ↑ +57.2% |
| Click-through rate | 3.84% | 3.02% | ↓ −21.4% |
| Clicks (derived) | ≈3,810 | ≈5,622 | ↑ +48% |
Clicks are derived — conversions ÷ conversion rate, from figures shown in the screenshots.
In a vertical where scaling normally inflates cost per lead, a 57% budget increase produced 62% more conversions at a cost per lead that did not move. The efficiency did not come from bidding harder; it came from the account being able to see which enquiries were worth buying.
The Screenshots Behind Every Number
Four panels below, two per period. The same date ranges are shown twice because the Microsoft Ads panel displays four metrics at a time — one view shows conversion rate, the other shows click-through rate, including the reading that got worse.
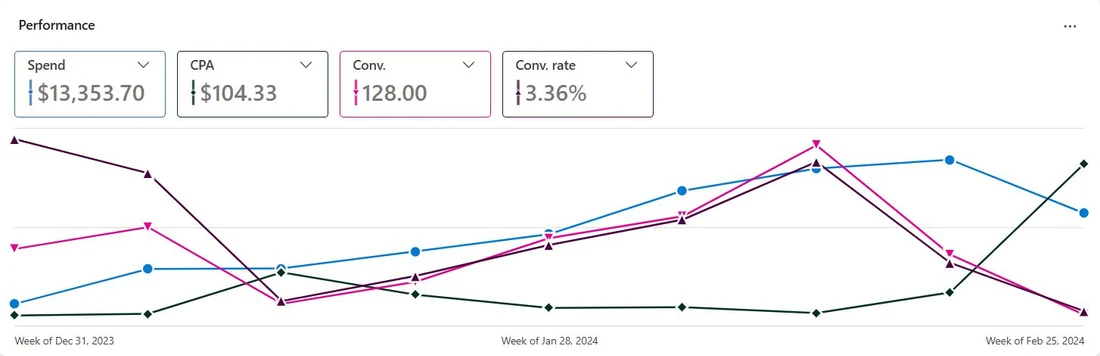
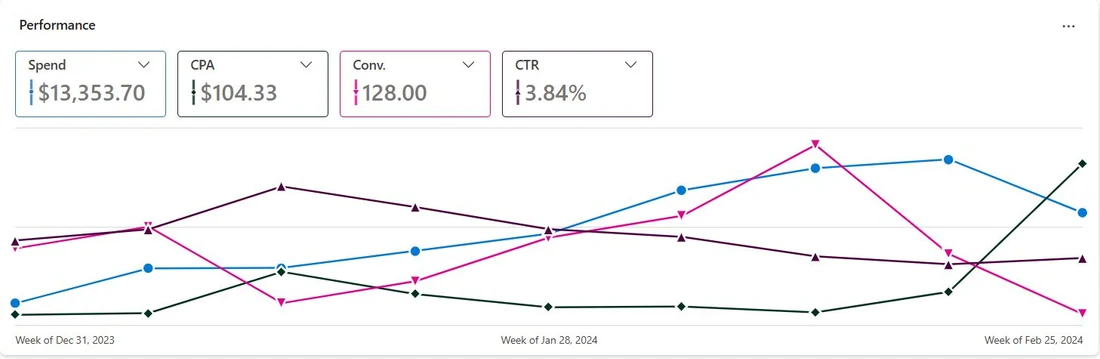
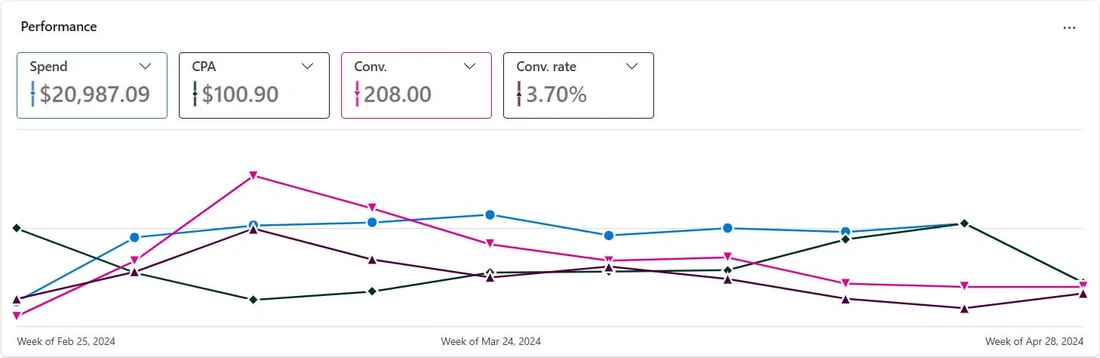
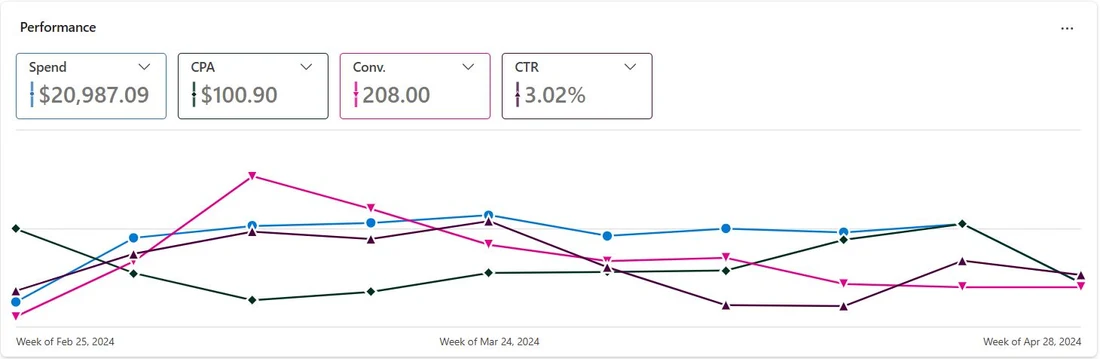
Click-through rate fell, from 3.84% to 3.02%. That is what widening reach looks like — impressions grew faster than clicks, so the rate diluted. What matters is what happened to the clicks that were bought: conversion rate on them rose 10% and cost per lead held. We publish the drop, and the screenshot showing it, because a case study that only displays the metrics that improved is not evidence of anything.
Get This Case Study as a PDF
The complete 7-page breakdown — baseline, intervention, before-and-after evidence, and the results — saved for whenever you need it.
Your download is starting. We've also sent a confirmation link to your inbox — click it to keep getting new case studies. Didn't start? Click here.
🔒 No spam. Case studies and marketing tips only. Unsubscribe anytime.
Is This Your Lead Generation Account?
This case study is relevant if any of the following sounds familiar: