Revenue Was There. The Target Wasn't.
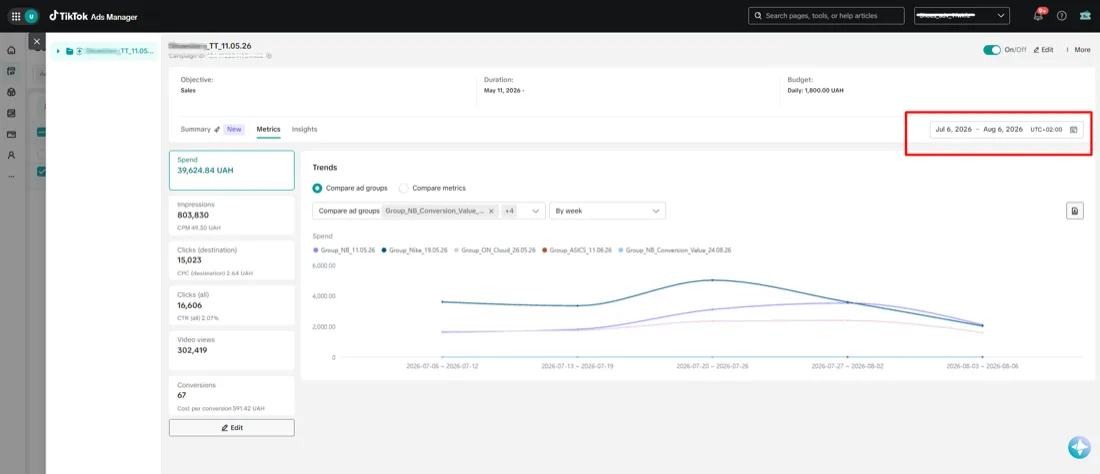
In the baseline month (6 July – 6 August 2026) the account spent ₴39,625 and produced 67 purchases at ₴591 each, for a ROAS of 5.65. The client's ask was specific: more orders without a proportional budget increase, ROAS of 8 or higher, and cost per purchase in the ₴300–350 range.
Traffic itself wasn't cheap to begin with — ₴2.64 per click at a 1.87% click-through rate — and the algorithm was collecting a lot of low-intent clicks relative to the buyers it produced.
Running catalog ads that treat every product the same?
A free audit shows exactly where cheap traffic is masking a purchase problem.No Pauses. No Budget Swings. One New Group.
The foundation ran unchanged across both periods. The lift came from targeted moves during August — the account was never paused and budgets never moved more than 20% at once.
Catalog Ads Split by Brand, Not One Feed
The account runs a 1,295-item product catalog synced automatically from the Horoshop feed. Instead of one shared pool, each ad group was assigned its own product set — Nike only, New Balance only, ON Cloud only — so the algorithm learns on a homogeneous signal and that brand's own audience rather than the full range at once. Size variants stay linked through item_group_id so one shoe never splits into a card per size.
Clean Purchase Data, Not Just Clicks or Views
Groups optimise for the Purchase event, delivered through both the on-site pixel and the Horoshop Events API server-side, deduplicated by event_id. Pangle and the Global App Bundle were excluded from placements — costing more on CPM but removing junk traffic from third-party apps. Without a reliable order value behind it, the later move to value-based optimisation would not have been possible.
Discipline Over Intervention
From August 6–16, nothing was paused and no budget moved by more than 20% in one step — every pause or sharp jump pushes a group back into learning, costing 3–7 days of degraded performance. Edits went into existing ad groups rather than duplicates, to keep their learning history intact. On August 17 new sneaker models were added to the product sets and part of the budget was reallocated to the strongest-ROAS groups.
Value-Based Optimisation — the Main Driver
On August 24, Group_NB_Conversion_Value_24.08.26 launched, optimising for purchase value instead of treating a ₴2,000 pair and a ₴6,000 pair as the same event. In its first week it ran on 25% less budget than the older New Balance group and delivered 33% more purchase value — ROAS 7.61 against 4.28. Week two confirmed it, and this group became the main driver of the account-level ROAS increase.
Running throughout: remarketing split by brand (New Balance browsers, Nike browsers, and a broad 180-day group for the rest), with anyone who purchased in the last 30 days excluded — and continuous A/B testing of short Ukrainian-language ad copy across urgency, social proof, size scarcity, and objection handling (try before you pay, delivery across Ukraine). Weak lines were cut; strong ones stayed in rotation.
79% More Orders. 35% Cheaper Each.
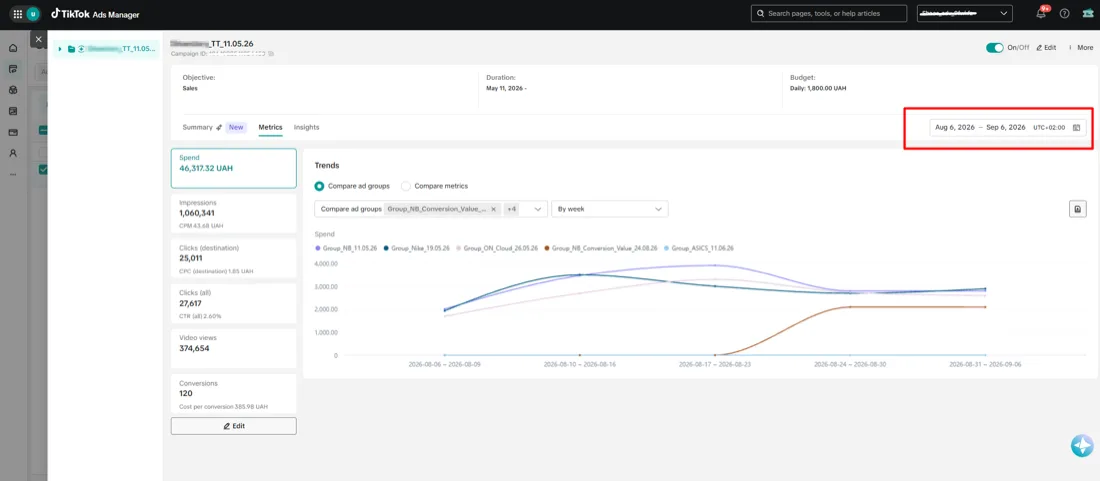
Across the second month the account spent ₴46,317, produced 120 purchases at ₴386 each on ₴379,585 of purchase value, at a ROAS of 8.20 — clearing the client's target of 8+, though cost per purchase landed just above the ₴300–350 goal rather than inside it.
| Metric | Before | After | Change |
|---|---|---|---|
| Ad spend | ₴39.6K | ₴46.3K | ↑ +16.9% |
| Website purchases | 67 | 120 | ↑ +79.1% |
| Purchase value (revenue) | ₴223.8K | ₴379.6K | ↑ +69.6% |
| ROAS | 5.65× | 8.20× | ↑ +45.1% |
| Cost per purchase | ₴591 | ₴386 | ↓ −34.7% |
| CTR | 1.87% | 2.36% | ↑ +26.2% |
| Average order value | ₴3,340 | ₴3,163 | ↓ −5.3% |
All figures are read directly off the two TikTok Ads Manager exports published below.
At July's cost per purchase, the second month's ₴46,317 budget would have bought roughly 78 orders. The account delivered 120 — the 42-order gap came from cutting cost per purchase, not from a bigger budget. That works out to ₴23.3 of extra revenue per additional hryvnia spent, and ₴24,653 saved acquiring the same 120 purchases at July's rate. Blended across both months: ₴603,383 of revenue on ₴85,942 of spend, a 7.02× ROAS.
The Screenshots Behind Every Number
Both panels below are unedited exports from the client's own TikTok Ads Manager account, for the two periods compared above.
We don't claim credit for all of it. The move to value-based optimisation is confirmed over two consecutive weeks against a direct control, and it couldn't have launched at all without per-brand product sets and clean, deduplicated purchase data underneath it — those parts we stand behind. Two things also played a part that we can't take credit for: late August and early September traditionally bring a seasonal lift in footwear demand, and no new video creatives were added during this period, so we don't attribute any of the growth to fresh creative — that's untapped headroom for the next stage, not something we already banked.
Get This Case Study as a PDF
The exact 8-page breakdown — every screenshot, the full results table, and the value-based optimisation setup — saved for whenever you need it.
Your download is starting. We've also sent a confirmation link to your inbox — click it to keep getting new case studies. Didn't start? Click here.
🔒 No spam. Case studies and marketing tips only. Unsubscribe anytime.
Is This Your Account?
This case study is relevant if any of the following sounds familiar: